Home>Mathematics>How To Graph A Parabola
Mathematics
How To Graph A Parabola
Published: February 26, 2024
Learn how to graph a parabola in mathematics with step-by-step instructions and examples. Master the art of parabola plotting today!
(Many of the links in this article redirect to a specific reviewed product. Your purchase of these products through affiliate links helps to generate commission for Regretless.com, at no extra cost. Learn more)
Table of Contents
Introduction
Graphing a parabola is an essential skill in mathematics and has practical applications in various fields, including physics, engineering, and computer science. Understanding how to graph a parabola enables us to visualize and analyze quadratic functions, which are prevalent in real-world scenarios. Whether you're a student learning about parabolas for the first time or someone looking to refresh their knowledge, mastering the art of graphing a parabola is both rewarding and intellectually stimulating.
In this comprehensive guide, we will delve into the fundamental principles of graphing a parabola, providing step-by-step instructions and valuable insights to demystify this mathematical concept. By the end of this article, you will have a solid grasp of the parabola equation, the significance of the vertex, the axis of symmetry, and the process of plotting and drawing a parabola on a graph. Whether you're a visual learner or someone who prefers working with equations, this guide will equip you with the knowledge and confidence to graph parabolas with ease.
So, let's embark on this mathematical journey together, where we will unravel the beauty and elegance of parabolas, empowering you to conquer the intricacies of graphing these captivating curves. Get ready to sharpen your pencils, dust off your graphing paper, and immerse yourself in the world of parabolas as we explore the art and science of graphing a parabola.
Understanding the Parabola Equation
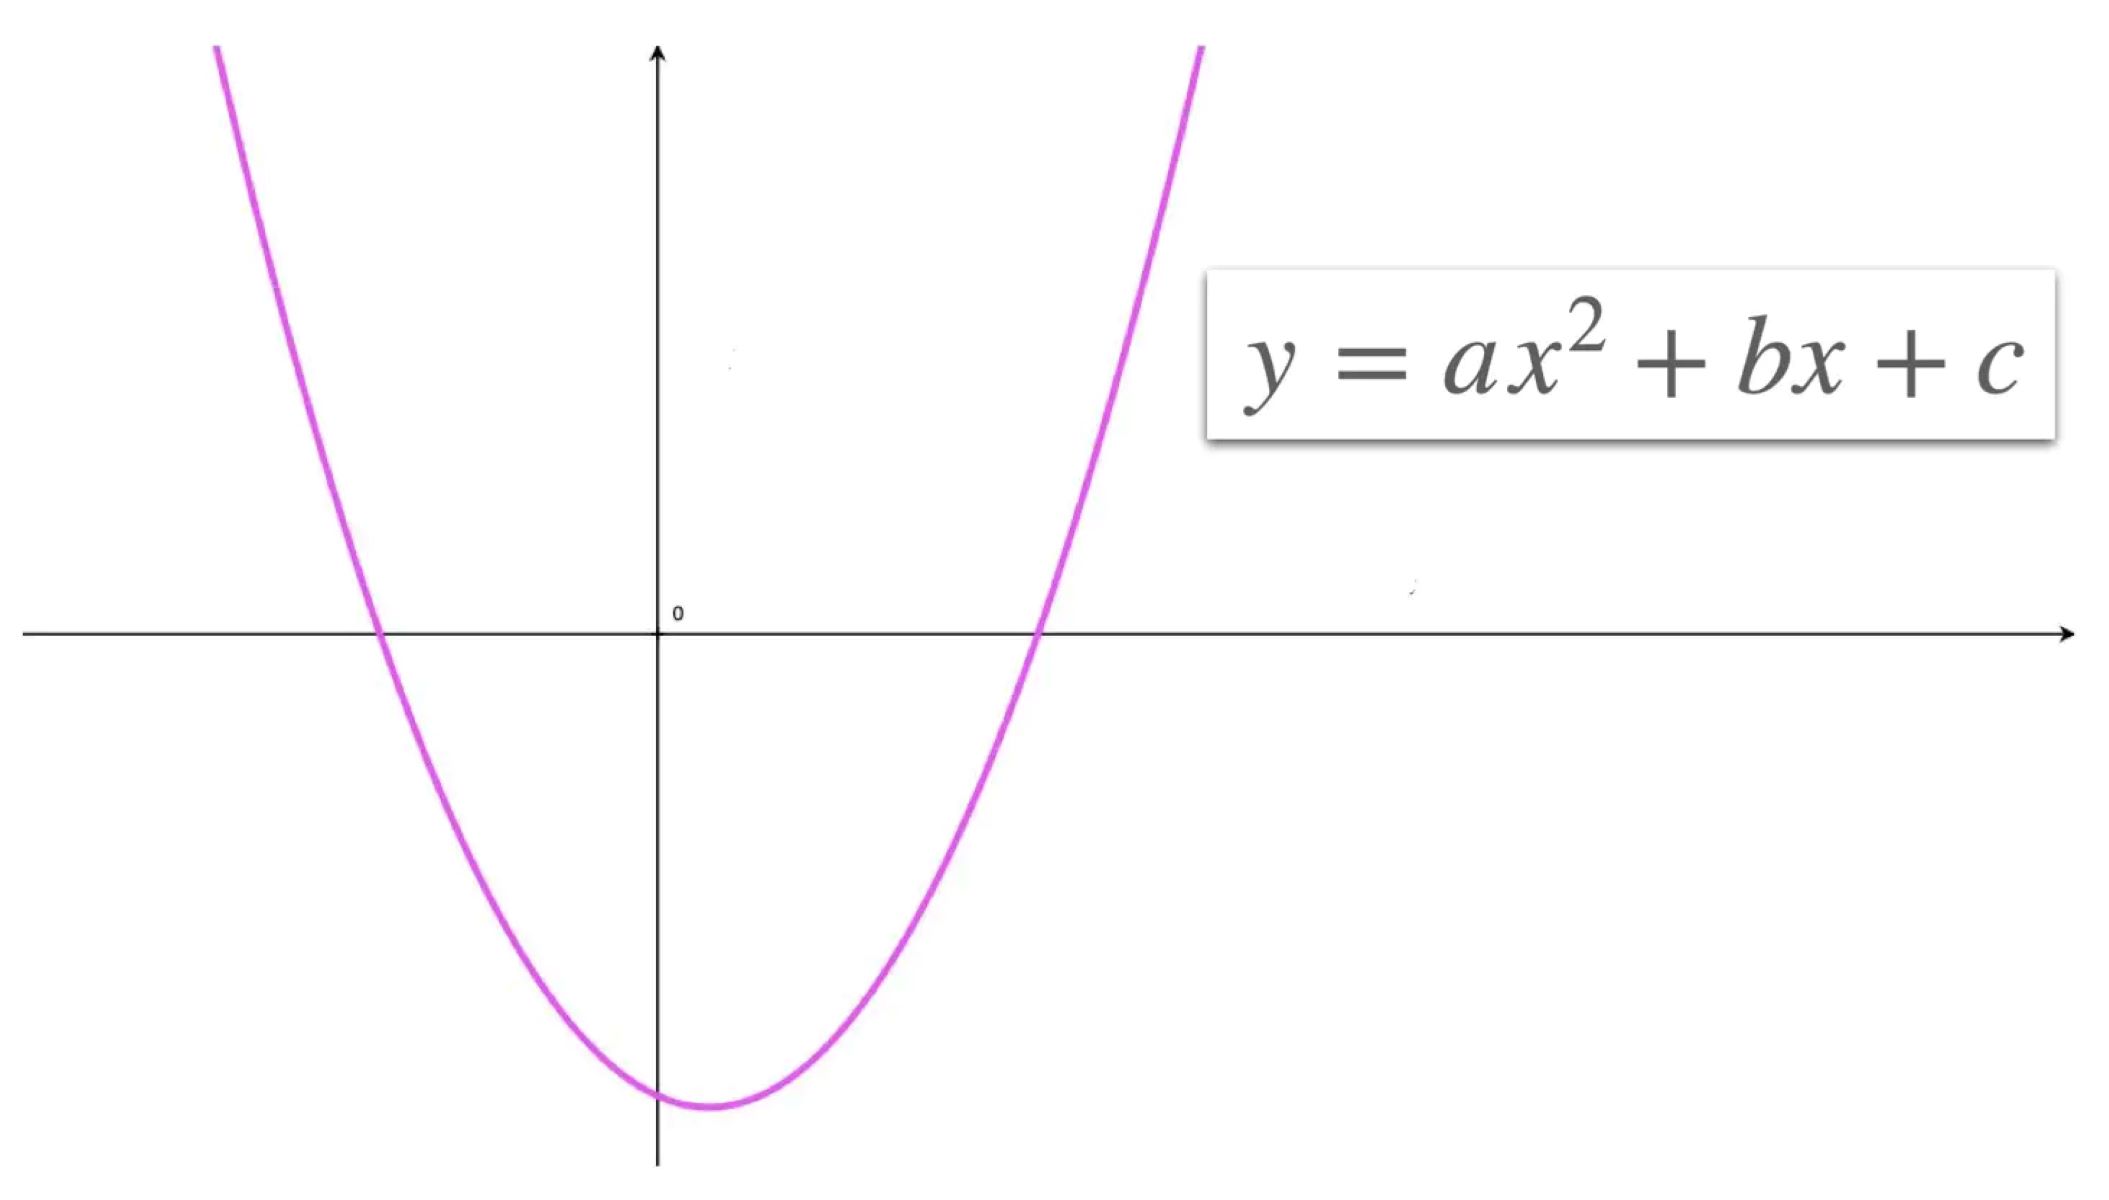
The parabola equation is a fundamental element in graphing a parabola. It is represented in the form of y = ax^2 + bx + c, where 'a', 'b', and 'c' are constants. This equation embodies the essence of a parabola, defining its shape, position, and orientation on the coordinate plane.
The coefficient 'a' in the parabola equation determines the direction of the parabola's opening and its width. If 'a' is positive, the parabola opens upward, creating a "U" shape, while a negative 'a' value results in a downward-opening parabola, resembling an inverted "U". The magnitude of 'a' influences the steepness of the curve, with larger values leading to narrower parabolas and smaller values producing wider curves.
The constants 'b' and 'c' play crucial roles in determining the horizontal position and vertical shift of the parabola, respectively. The 'b' term affects the symmetry of the parabola, influencing its horizontal position on the graph. Meanwhile, the 'c' term dictates the vertical shift of the parabola, determining its position relative to the y-axis.
Understanding the parabola equation empowers us to interpret the behavior of quadratic functions and visualize their graphical representations. By analyzing the coefficients 'a', 'b', and 'c', we gain valuable insights into the characteristics of the parabola, such as its vertex, axis of symmetry, and the direction in which it opens.
In essence, the parabola equation serves as a mathematical blueprint, guiding us in the process of graphing a parabola with precision and clarity. It encapsulates the essence of quadratic functions, offering a window into the captivating world of parabolas and their intricate geometric properties. With a firm grasp of the parabola equation, we are poised to embark on the exhilarating journey of plotting and graphing these elegant curves on the coordinate plane.
Plotting the Vertex
The vertex of a parabola is a pivotal point that holds significant geometric and algebraic importance. It serves as the turning point of the parabolic curve, marking the transition between its increasing and decreasing segments. To plot the vertex of a parabola, we must first understand its coordinates and the role they play in defining the parabola's position on the graph.
In the standard form of the parabola equation, y = ax^2 + bx + c, the x-coordinate of the vertex can be determined using the formula x = -b/2a. This formula derives from the axis of symmetry of the parabola, which is a vertical line that passes through the vertex, dividing the parabola into two symmetrical halves. The x-coordinate of the vertex corresponds to the x-value of the axis of symmetry, providing a pivotal reference point for graphing the parabola.
Once we have calculated the x-coordinate of the vertex, we can substitute this value back into the parabola equation to find the corresponding y-coordinate. By evaluating the equation at x = -b/2a, we obtain the y-coordinate of the vertex, completing the coordinates necessary to plot this critical point on the graph.
The vertex of a parabola embodies essential characteristics that define its behavior and shape. For a parabola with a positive 'a' coefficient, the vertex represents the lowest point on the graph, marking the minimum value of the quadratic function. Conversely, in a parabola with a negative 'a' coefficient, the vertex corresponds to the highest point on the graph, representing the maximum value of the function.
Plotting the vertex on the graph provides a foundational reference point for sketching the parabolic curve with precision and accuracy. It serves as the starting point for understanding the parabola's orientation, aiding in the visualization of its concavity and the direction in which it opens. By mastering the art of plotting the vertex, we gain a deeper appreciation for the elegance and mathematical significance of parabolas, paving the way for a seamless transition to the subsequent steps of graphing a parabola.
In essence, the vertex of a parabola encapsulates the essence of its geometric and algebraic properties, serving as a beacon of insight into the behavior of quadratic functions. By mastering the process of plotting the vertex, we unlock the key to unraveling the mysteries of parabolic curves, setting the stage for a captivating exploration of their graphical representations on the coordinate plane.
Finding the Axis of Symmetry
The axis of symmetry is a fundamental concept in graphing a parabola, playing a pivotal role in determining its symmetry and aiding in the precise visualization of its graphical representation. Understanding how to find the axis of symmetry equips us with a powerful tool for accurately plotting and graphing parabolic curves on the coordinate plane.
In the standard form of the parabola equation, y = ax^2 + bx + c, the axis of symmetry is a vertical line that passes through the vertex, dividing the parabola into two symmetrical halves. To find the equation of the axis of symmetry, we utilize the x-coordinate of the vertex, which is given by x = -b/2a. This formula provides a direct method for determining the x-value of the axis of symmetry, serving as a crucial reference point for graphing the parabola.
The axis of symmetry holds profound geometric significance, serving as a mirror line that reflects the parabola's shape and ensures its symmetrical properties. By identifying the axis of symmetry, we gain valuable insights into the parabola's concavity and the precise location of its vertex, facilitating the process of graphing the parabolic curve with precision and clarity.
Once we have determined the equation of the axis of symmetry, we can seamlessly integrate it into the graphing process, providing a foundational reference line for plotting additional points and visualizing the parabola's symmetrical nature. This vertical line serves as a guiding principle, enabling us to maintain symmetry and balance as we sketch the parabolic curve on the graph.
The axis of symmetry embodies the essence of equilibrium and balance within the parabolic curve, offering a profound insight into the geometric harmony of quadratic functions. By mastering the art of finding the axis of symmetry, we unlock a gateway to the captivating world of parabolas, where symmetry and precision converge to create visually stunning and mathematically profound curves.
In essence, the axis of symmetry serves as a guiding beacon, illuminating the path to a deeper understanding of parabolic curves and their symmetrical properties. By embracing the significance of the axis of symmetry, we embark on a transformative journey, where mathematical precision and visual elegance intertwine to reveal the captivating allure of graphing a parabola.
Determining the Direction of the Parabola
The direction in which a parabola opens is a defining characteristic that profoundly influences its graphical representation and geometric behavior. By understanding how to determine the direction of the parabola, we gain valuable insights into its concavity and the overall shape of the curve on the coordinate plane.
The coefficient 'a' in the parabola equation, y = ax^2 + bx + c, plays a pivotal role in determining the direction of the parabola's opening. If 'a' is positive, the parabola opens upward, creating a U-shaped curve that extends infinitely in both the positive and negative y-directions. This upward orientation signifies the presence of a minimum point at the vertex, where the parabola reaches its lowest y-value.
Conversely, when 'a' is negative, the parabola opens downward, resembling an inverted U-shaped curve that extends infinitely in both the positive and negative y-directions. In this scenario, the vertex represents the maximum point of the parabola, marking the highest y-value attained by the quadratic function.
Understanding the direction of the parabola is essential for visualizing its concavity and predicting the behavior of the quadratic function. A positive 'a' coefficient signifies a parabola that opens upward, while a negative 'a' coefficient indicates a parabola that opens downward. This distinction provides a fundamental insight into the orientation and overall shape of the parabolic curve, guiding the process of graphing it with precision and clarity.
By mastering the art of determining the direction of the parabola, we gain a deeper appreciation for the geometric properties and visual elegance of parabolic curves. This understanding empowers us to interpret the behavior of quadratic functions and predict the graphical representation of parabolas, fostering a seamless transition to the subsequent steps of graphing these captivating curves on the coordinate plane.
In essence, the direction of the parabola serves as a visual indicator of its concavity and orientation, offering a profound glimpse into the geometric nature of quadratic functions. By embracing the significance of the parabola's direction, we embark on a transformative journey, where mathematical precision and visual elegance converge to reveal the captivating allure of graphing a parabola.
Plotting Additional Points
Once we have determined the vertex, axis of symmetry, and the direction of the parabola, the next step in graphing a parabola involves plotting additional points to accurately sketch its curve on the coordinate plane. By strategically selecting and plotting these points, we gain a comprehensive understanding of the parabola's shape and behavior, allowing us to visualize its trajectory with precision and clarity.
To plot additional points on the parabola, we can utilize the symmetry of the curve to our advantage. Since the parabola is symmetric about its axis of symmetry, any points located equidistant from the axis in opposite directions will have the same y-coordinate. By leveraging this symmetry, we can efficiently identify and plot corresponding points on either side of the axis of symmetry, ensuring a balanced and visually appealing representation of the parabolic curve.
One effective strategy for plotting additional points involves selecting x-values that are equidistant from the axis of symmetry. By choosing x-values that are symmetrically positioned relative to the axis, we can calculate the corresponding y-values using the parabola equation, y = ax^2 + bx + c. This approach allows us to systematically generate a series of points that capture the essence of the parabola's curvature, enabling us to visualize its shape with accuracy and finesse.
Furthermore, by strategically selecting x-values that are evenly spaced on either side of the vertex, we can ensure a comprehensive depiction of the parabola's behavior across the entire graph. This systematic approach to plotting additional points empowers us to gain a holistic understanding of the parabola's trajectory, facilitating the visualization of its concavity and the smooth transition between its increasing and decreasing segments.
As we meticulously plot these additional points, we witness the parabola's graceful curvature come to life on the graph, each point contributing to the cohesive portrayal of its elegant and mathematically profound shape. This meticulous process of plotting additional points serves as a testament to the precision and artistry inherent in graphing a parabola, allowing us to appreciate the intricate interplay between mathematics and visual representation.
In essence, the strategic plotting of additional points embodies the essence of precision and symmetry, offering a captivating glimpse into the geometric elegance of parabolic curves. By embracing this meticulous approach, we embark on a transformative journey, where mathematical precision and visual elegance converge to reveal the captivating allure of graphing a parabola.
Drawing the Parabola on a Graph
With the essential elements of the parabola in place, including the vertex, axis of symmetry, and strategically plotted additional points, we are poised to embark on the final step of graphing a parabola: drawing the parabolic curve on the graph. This transformative process brings together the mathematical precision and visual elegance inherent in parabolic curves, culminating in a captivating portrayal of their geometric properties on the coordinate plane.
Drawing the parabola involves connecting the plotted points with a smooth, continuous curve that encapsulates the essence of the quadratic function. By carefully tracing the trajectory of the parabolic curve, we unveil its graceful concavity and the seamless transition between its increasing and decreasing segments. This meticulous process requires a delicate balance of precision and artistry, as we strive to capture the visual allure and mathematical significance of the parabola.
The vertex serves as the focal point from which the parabolic curve emanates, representing the pivotal transition between its upward or downward orientation. As we draw the parabola, we pay homage to the vertex, honoring its geometric significance and the profound influence it exerts on the curve's behavior. The curve gracefully extends from the vertex, embodying the essence of the quadratic function and the captivating elegance of parabolic curves.
The axis of symmetry, a guiding beacon of balance and symmetry, ensures the harmonious portrayal of the parabola's shape on the graph. As we trace the curve, we honor the axis of symmetry, embracing its role in maintaining the parabola's symmetrical properties and visual appeal. This vertical line serves as a steadfast companion, guiding the curvature of the parabola and ensuring its graceful portrayal on the coordinate plane.
The meticulously plotted additional points, strategically positioned to capture the essence of the parabola's curvature, converge to form a cohesive and visually stunning representation of the curve. As we connect these points with precision and finesse, the parabola emerges as a captivating embodiment of mathematical elegance, its graceful curvature breathing life into the graph and captivating the imagination.
In essence, drawing the parabola on a graph transcends the realm of mathematical representation, offering a transformative journey where precision and artistry converge to reveal the captivating allure of parabolic curves. This final step encapsulates the essence of graphing a parabola, where mathematical precision and visual elegance intertwine to create a visually stunning and intellectually profound portrayal of the quadratic function.
Conclusion
In conclusion, the art and science of graphing a parabola encapsulate the captivating interplay between mathematical precision and visual elegance. Through our journey, we have unraveled the fundamental principles underlying the graphing of parabolic curves, delving into the intricacies of the parabola equation, the significance of the vertex, the axis of symmetry, and the meticulous process of plotting and drawing the parabola on a graph.
Graphing a parabola is not merely a mathematical exercise; it is a transformative journey that unveils the captivating allure of quadratic functions and their graphical representations. The parabola equation serves as a mathematical blueprint, guiding us in the process of graphing a parabola with precision and clarity. By analyzing the coefficients 'a', 'b', and 'c', we gain valuable insights into the characteristics of the parabola, such as its vertex, axis of symmetry, and the direction in which it opens.
The vertex, a pivotal point that holds significant geometric and algebraic importance, serves as the turning point of the parabolic curve, marking the transition between its increasing and decreasing segments. Plotting the vertex provides a foundational reference point for sketching the parabolic curve with precision and accuracy, offering a deeper appreciation for the elegance and mathematical significance of parabolas.
Understanding the axis of symmetry equips us with a powerful tool for accurately plotting and graphing parabolic curves on the coordinate plane. This vertical line serves as a guiding principle, enabling us to maintain symmetry and balance as we sketch the parabolic curve on the graph, illuminating the path to a deeper understanding of parabolic curves and their symmetrical properties.
The direction in which a parabola opens is a defining characteristic that profoundly influences its graphical representation and geometric behavior. By mastering the art of determining the direction of the parabola, we gain a deeper appreciation for the geometric properties and visual elegance of parabolic curves, paving the way for a seamless transition to the subsequent steps of graphing a parabola.
Drawing the parabola on a graph brings together the mathematical precision and visual elegance inherent in parabolic curves, culminating in a captivating portrayal of their geometric properties on the coordinate plane. This transformative process offers a transformative journey where precision and artistry converge to reveal the captivating allure of parabolic curves, creating a visually stunning and intellectually profound portrayal of the quadratic function.
In essence, the journey of graphing a parabola transcends the realm of mathematical representation, offering a transformative experience where precision and artistry converge to reveal the captivating allure of parabolic curves. This final step encapsulates the essence of graphing a parabola, where mathematical precision and visual elegance intertwine to create a visually stunning and intellectually profound portrayal of the quadratic function.